The results page – recent history charts
The results page is where the items identified in your searches will appear, and where you can sort, filter, and analyse the results. This guide explains how to use the ‘recent history’ graphs to get a clearer idea of sales rank and price performance over time.
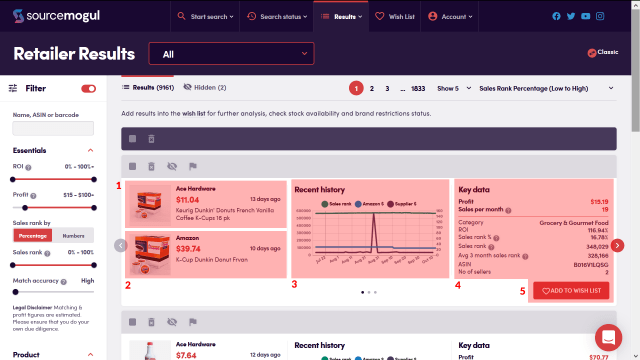
In your results page you can start to analyse the products in your search results. The results window gives you the images of the product on both the retailer page and the Amazon page for quick comparison.
(1) shows the product detail from the retailer page, including the retailer’s name, product price and description.
(2) then gives comparable information on the Amazon listing, with product price and description. Both information boxes at (1) and (2) are also hyperlinks to the retailer’s product page, and to Amazon’s product page.
Finally, the text at the bottom of both boxes indicates how long ago both sites showed this information as correct, i.e. the time of scanning by SourceMogul.
(3) shows the Recent History graph, which includes vital information for analysing potential opportunities, including the Sales Rank history depicted by the green line, the Amazon price history, which is shown by the blue line, and the retailer’s product selling history, depicted by the purple line, which indicates the price history of the product on the retailers site.
(4) gives a further breakdown of the Key Data necessary for analysing a product, including the expected profit after Amazon fees have been deducted, the average number of times the product sells on Amazon per month, and the Amazon category the product belongs in. You can also see the ROI (Return on Investment) percentage, the sales rank depicted as both a percentage and a number, the three month average sales rank, the product’s ASIN, and the no of sellers currently selling this product on Amazon.
At (5) you can click to add the product to your wishlist.
Clicking the red arrow at the right hand side of the panel will take you onto the next page of data for the product.
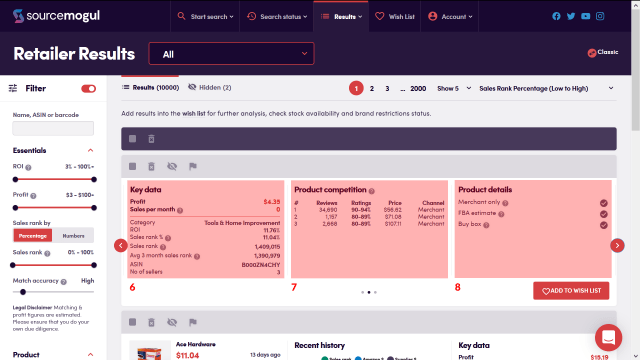
(6) gives you a further breakdown of the competition, by showing the top sellers of the product on Amazon, with information on the number of their Amazon seller reviews, and how many of these were positive, the price the seller has listed the product for, and the channel of fulfilment they use, whether FBA or FBM.
(7) provides information on the product listing, by showing if the product is being sold by FBM only, if the FBA fees listed by SourceMogul are an estimate due to lack of product information from Amazon, and if the product listing has a buy box. A tick to the right of each point will indicate a yes answer, a cross shows no.
(8) shows you the information Amazon holds on the product dimensions and weight.
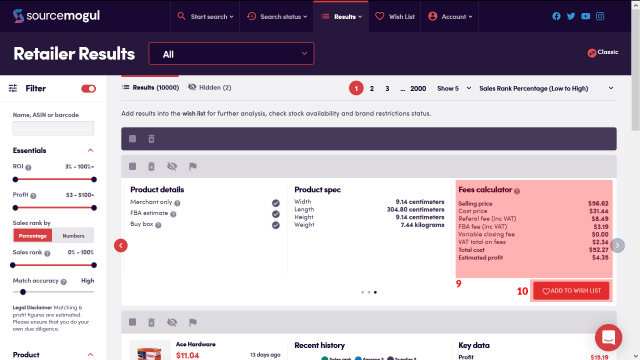
Clicking the red arrow at the right hand side of the panel again will take you onto the final page of data for the product.
(9) gives you the breakdown costs involved, including the Amazon fees associated with the product, and how SourceMogul has calculated the potential profit to be made.
And again, at (10), you can click to add the product to your wishlist.
More guides
-

How to find and enter an Amazon API key
On first login to SourceMogul, you will be prompted to enter your Amazon API…
-
How to start a retailer search
SourceMogul offers the ability to quickly search hundreds of retailer websites for products that…
-
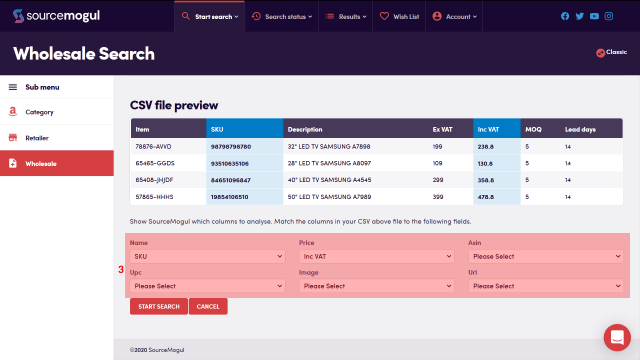
How to start a wholesaler search
SourceMogul has a Wholesale CSV feature, which lets users upload wholesaler lists to compare…
-
Viewing completed searches
SourceMogul saves completed searches for future reference, which means you can run searches and…